Next: Segment-Level Cluster Purification Up: Frame-Level Cluster Purification Previous: Frame-Based Cluster Purification Metrics Contents
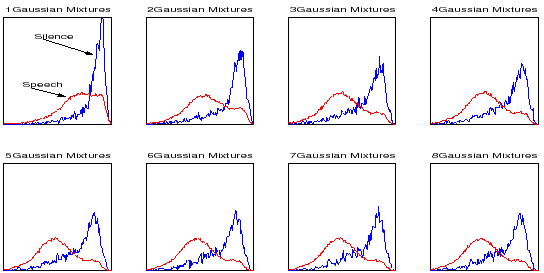
When running the Speaker Diarization algorithm, each cluster is modeled with a variable number of Gaussian mixtures according to the amount of data it contains. It is necessary to analyze at what cluster complexity this behavior is present and the presented metrics can be used. In figure 4.12, the histograms of speech and non-speech (according to the reference file) are shown of metric 1 evaluated using models ranging from 1 to 8 mixtures. All model complexities have been trained with the same data and used to evaluate metric 1 on all the meeting in the same way as in figure 4.9.
It is seen that only the case of 1 Gaussian mixture shows a bigger overlap between the speech and non-speech histograms, while after 3 mixtures all plots seem identical (in fact, running the same experiments from 1 to 20 mixtures/model gives identical results from 9 to 20). The frame-level purification algorithm is therefore applied whenever the number of Gaussian mixtures is greater than one.
The algorithm is used when gathering the data to compare two
clusters using the ![]() BIC metric in the following way:
BIC metric in the following way:
user 2008-12-08